

How to Analyze Banks and Non Banking Finance Companies (NBFC)
Table of Content
- Introduction
- How do banks make money?
- Banking Metrics
- RBI Policy Terms
Introduction
In a country like India, large section of the population is under-banked. The penetration of mortgages and consumer finance is also very low compared to not just the developed economies but even the other emerging economies. This suggests that financial services space has great potential for lot of growth in the coming times.
In this post, We will look at how to analyze Banks and Non Banking Finance Companies (NBFC). We will go through various concepts and ratios that can help to analyze these companies.
The mindmap below shows the broad structure of Banks and NBFCs.

How do banks make money?
The raw material of the banking business is ‘Cash’. This makes banking a commoditized business as the borrower may care only for lower rate of interest and does not care where he gets his money from.
Bank borrows money and lends it to someone who it thinks will return it back as per the terms of agreement. To create shareholder wealth, a bank has to ensure that:
- Asset side:
- It manages risk by keeping delinquencies in check
- Liability side:
- It is able to get lower cost deposits as part of its borrowing program.
- Expense side:
- Keep operating costs in control
Risk Management
Investors in financial stocks should focus on banks that manage their risks better than the ones which remain focused on solely growing through loan book and network expansion. Focus on banks that manage their risks better than the ones which remain focuses on only growing their business through loan book and network expansion
Banks can borrow up to 8-10 times their net worth so even small defaults can make them vulnerable to insolvency risks.
- Example
- A bank worth 100 $; can borrow another 900$ to create a loan portfolio of 1000 $
- Even a 5% delinquency or 50$ has the power to knock out 40% (50/125 * 100) of net worth
It is not difficult for a bank to generate a high rate of growth because there is never shortage of people who wants to borrow money. Hence in case of a lending business, a company that grows at 30% should be preferred to the one that grows at 30%
We will now look at Banking metrics that can help to understand about the lending businesses.
Banking Metrics
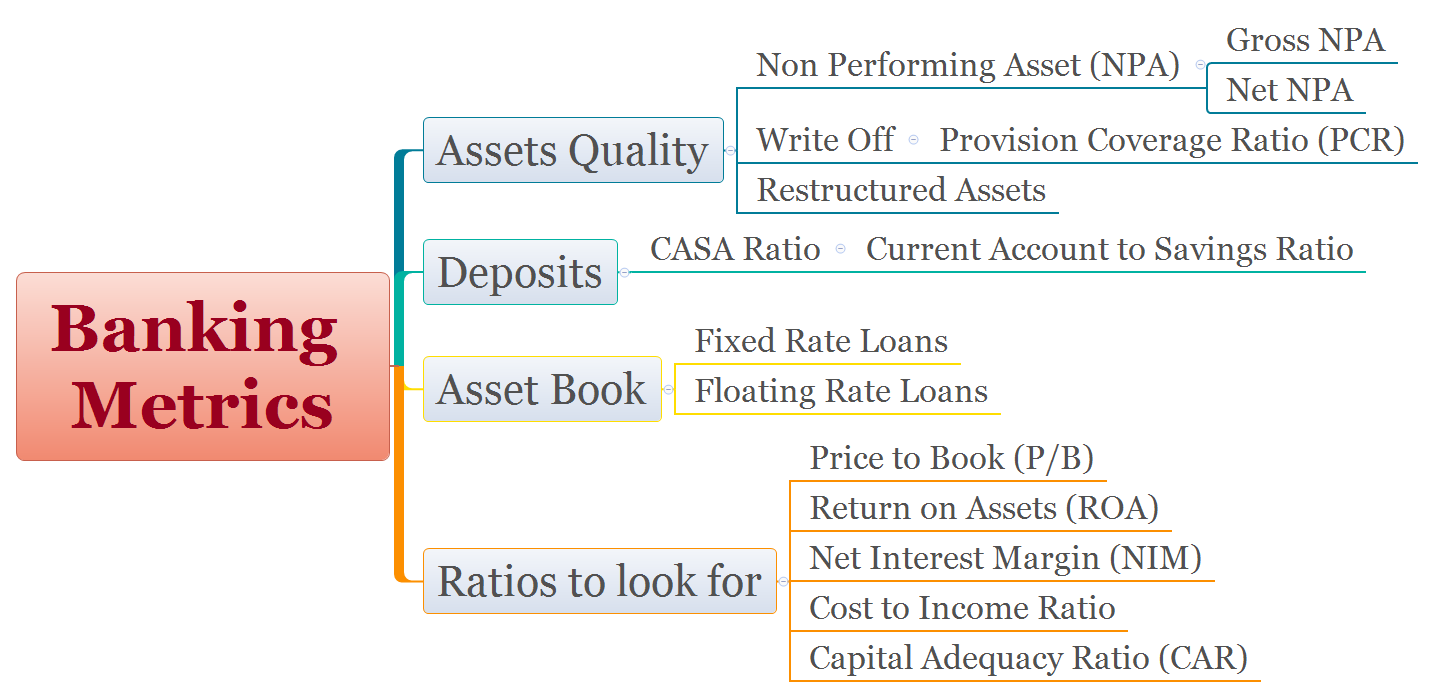
Asset Quality:
Non Performing Asset (NPA)
Non Performing Asset (NPA) is the lead indicator of the asset book
- Gross NPA : Tells about the overall level of delinquencies of the net NPA
- Net NPA : Indicates the amount of bad loan waiting to be written off, from the book of accounts.
Consider an example: A bank has gross NPA of 2% and net NPA of 0.5%
- It indicates that bank has written off 1.5% (2-0.5) of its bad loans against its incomes
- This write off is 75% (1.5/2) of the total bad loans
The write off in the above example is known as provision coverage ratio (PCR)
- The RBI stipulates all banks to have a PCR of at least 70%.
- Banks that have a PCR of less that that will have to increase provisioning .
- Hence they get impacted by reporting lower profits in the subsequent quarters.
Restructured assets
These are not NPA in the technical sense but are accounts for which the banks has restructured the repayment schedule for payment of interests and principle. Many banks hide their NPAs under the restructured assets so many times, a restructured asset is like NPA in disguise.
Reading annual reports
Reading annual report for finance companies is imperative to see the break up of a bank’s asset book.
Banks lending to interest sensitive sectors like basic industries, power, real estate, infrastructure or the small and medium units have to deal with a relatively large risk on their asset book.
Seasoning of Loans
There is something called seasoning out of loans for finance companies.
- An asset book which has gone up in the last one year is looked at more suspicion than asset book which has increased evenly over a longer period of time
- The reason for suspicion is that Borrowers don’t default on loans in the first year of receiving it
- Hence Non Performing Asset (NPA) as % of total loans will optically show a lower figure as these loans have not been seasoned out.
- A book value made of capital raised by QIPs and private placements will be valued less generously than a book created exclusively out of retained earnings.
Current Account to Savings Account (CASA) Ratio
The CASA ratio of a bank indicates the extent of low cost deposits. There are two components to it :
- Current Accounts (CA)
- For most banks this is really low cost
- Savings Accounts (SA)
- This now a days isn’t very low cost. Banks like Kotak offer higher savings deposits of 7%.
Some pointers related to CASA Ratio:
- Good banks with strong liability franchises like HDFC Bank, PNB, SBI etc. have a CASA Ratio > 40% which helps in reducing overall borrowing cost.
- These banks have a large retail deposit base. High retail deposit also makes it easier to maintain strong retail loan book.
- A bank with lower % of CASA deposit manages its shortfall by borrowing more from the wholesale debt market. E.g. Yes bank, IndusInd
- The stock prices of these low CASA banks fall more during periods of rising interest rates and rises faster during periods of falling interest rates.
- CASA Ratio swings with the interest rates.
- When interest rates are high, people prefer to remove money from their savings and current account deposits and put them into fix deposits.
Fixed and Floating rate Asset Book
The composition of advances play an important role in determining the profitability of a bank.
- A bank with greater percentage of fixed rate loans benefits in falling interest rate environment and suffer in case of rising interest rates. E.g. IndusInd
- A bank with higher % of floating rate can keep its margin secured against fluctuations from interest rate movement. E.g HDFC Bank.
Effect of equity dilution on book value of a Company
A bank that dilutes equity at a high price/book (P/B) is an instant re-rating candidate. When a bank dilutes expensive equity it raises the overall value of the book and makes the stock look cheaper on the post dilution price to book basis. There are many pointers related to dilution:
- The equity should be diluted at very high price/book value. A bank that issues capital at 5 P/B is better candidate for stock appreciation than a bank that raises capital at 2 P/B
- The quantum of dilution should be large when compared to book value.
- E.g. Raising capital equal for 70% of book value is better price appreciation candidate than raising capital for 20% of book value.
- Bank with higher ROE (> 20% ) is better re-rating candidate than a low ROE bank.
Example of equity dilution at high P/B
We will take an example of equity dilution for a housing finance company, Gruh to check how it makes a stock expensive on P/B to look cheaper.
- Price: 297, Reserves 571.2 Cr. Share capital 36.03 Cr.
- Book Value (BV) = 571.2 + 36= 607.2 Cr
- Book Value per Share (BVPS) = 607.2/36.3 = 16.7 Cr.
- Price to Book (P/B) = 297/16.7 = 18
If Gruh dilutes 10% equity at current BV:
- New Capital Infusion: (36.3 * 10% = 3.63)* 297 = 1078 Cr.
- New Book Value= 36.3 (Share Capital) + 1078 (New Capital)= 1685 Cr.
- New Share Capital = 36.3 + 10% of 36.3= 39.93
- New BVPS= 1685/39.93= 42.2
- New P/B= 297/42.2 = 7
As we see, a 10% equity dilution lead to P/B drop from 18 to 7.
Useful Ratio for Finance Companies
We will look some ratios than can help to make decision on a banking/NBFC company
Price to Book (P/B)
- A low P/B bank is not always a better option than the one which trades at higher P/B. Some reasons for a bank to trade at lower P/B:
- It generates a low ROE even after using lot of leverage.
- There is not enough predictability of growth because of its past history
- The market expects some deterioration in asset book of the bank.
Return on Assets (ROA)
You can read more about ROA in this post .
- ROA of above 1.3% is considered good and anything beyond 1.6% is excellent.
- Its important to look the quality of net profit income.
- Same ROA but with higher share of interest income which is more recurring in nature is better than ROA but with higher share of trading income which is more non recurrent in nature.
Net Interest Margin (NIM)
NIM is like the gross margin of a normal business.
- Banks engaged in unsecured retail lending generates higher NIM but also suffer from incrementally bad loans which balances out the higher margins.
- In general NIM hovers between 2.75% to 4.25 with the better managed banks generating a NIM of 4% and above.
NIM is reported in the quarterly/annual results. It can also be calculated by following formula :
NIM = Net Interest Income (Interest Income- Interest Income)
      _________________________________________________________
                    Average Earning Assets
Cost to Income Ratio
The Cost to income ratio indicates the level of operating cost for each unit of income.
Cost to Income ratio =     Operating expenses
                       _________________________________________________
                        Net Interest Income (NII) + Non Interest Income
Capital Adequacy Ratio (CAR)
CAR indicates the % of owners capital as a percentage of risk weighted assets.
Capital Adequacy Ratio (CAR) =     Tier I Capital + Tier II Capital
                                 ____________________________________________
                                      Risk Weighted Assets
Some pointers related to CAR:
- CAR is inversely proportional to its leverage on balance sheet and beyond a point the leverage cannot be increased as the RBI prescribes a minimum level of CAR.
- CAR also indicates how long the bank can continue to grow without raising further capital
- As CAR approaches RBI’s stipulated ratio, bank cannot grow at rates higher than its (ROE- payout ratio) and it will need to dilute further equity to shore up capital
RBI Policy Terms
The financial companies are affected by the monetary policies issued by Reserve Bank of India (RBI). Below is the description of different rates present in monetary policy.
| RBI Policy Terms | Description |
|---|---|
| Bank Rate | Rate at which central bank (RBI) lends money to other banks or financial institutions. Bank rate and Long-term interest rates are directly proportional to each other. |
| Repo Rate | Repo rate is the rate at which the central bank lends money to the banks. This rate signifies the rate at which liquidity is injected in the banking system by RBI |
| Reverse Repo Rate | The Reverse Repo rate is the rate at which banks park their short-term excess liquidity with the RBI. This rate signifies the rate at which the central bank absorbs liquidity from the banks |
| Cash Reserve Ratio (CRR) | The amount Banks in India are required to keep with RBI. Higher the CRR ratio, the lower is the amount that banks will be able to use for lending and investment. CRR is a tool used by RBI to control liquidity in the banking system. |
| Statutory Liquidity Ratio (SLR) | The amount that the banks are required to maintain in the form of Gold or Govt approved securities before providing Credit to the customers. SLR regulates the credit growth in India. |
Leave a Comment