
Financial Analysis- Ratio Analysis
This article is Part 4 in a 4-Part Series.
- Part 1 - Financial Analysis - Balance Sheet
- Part 2 - Financial Analysis- Income Statement
- Part 3 - Financial Analysis- Cash Flow Statement
- Part 4 - This Article
Investors and analysts routinely use ratios to communicate the value of companies and their stocks.
The below image shows the mind-map for major financial ratios:
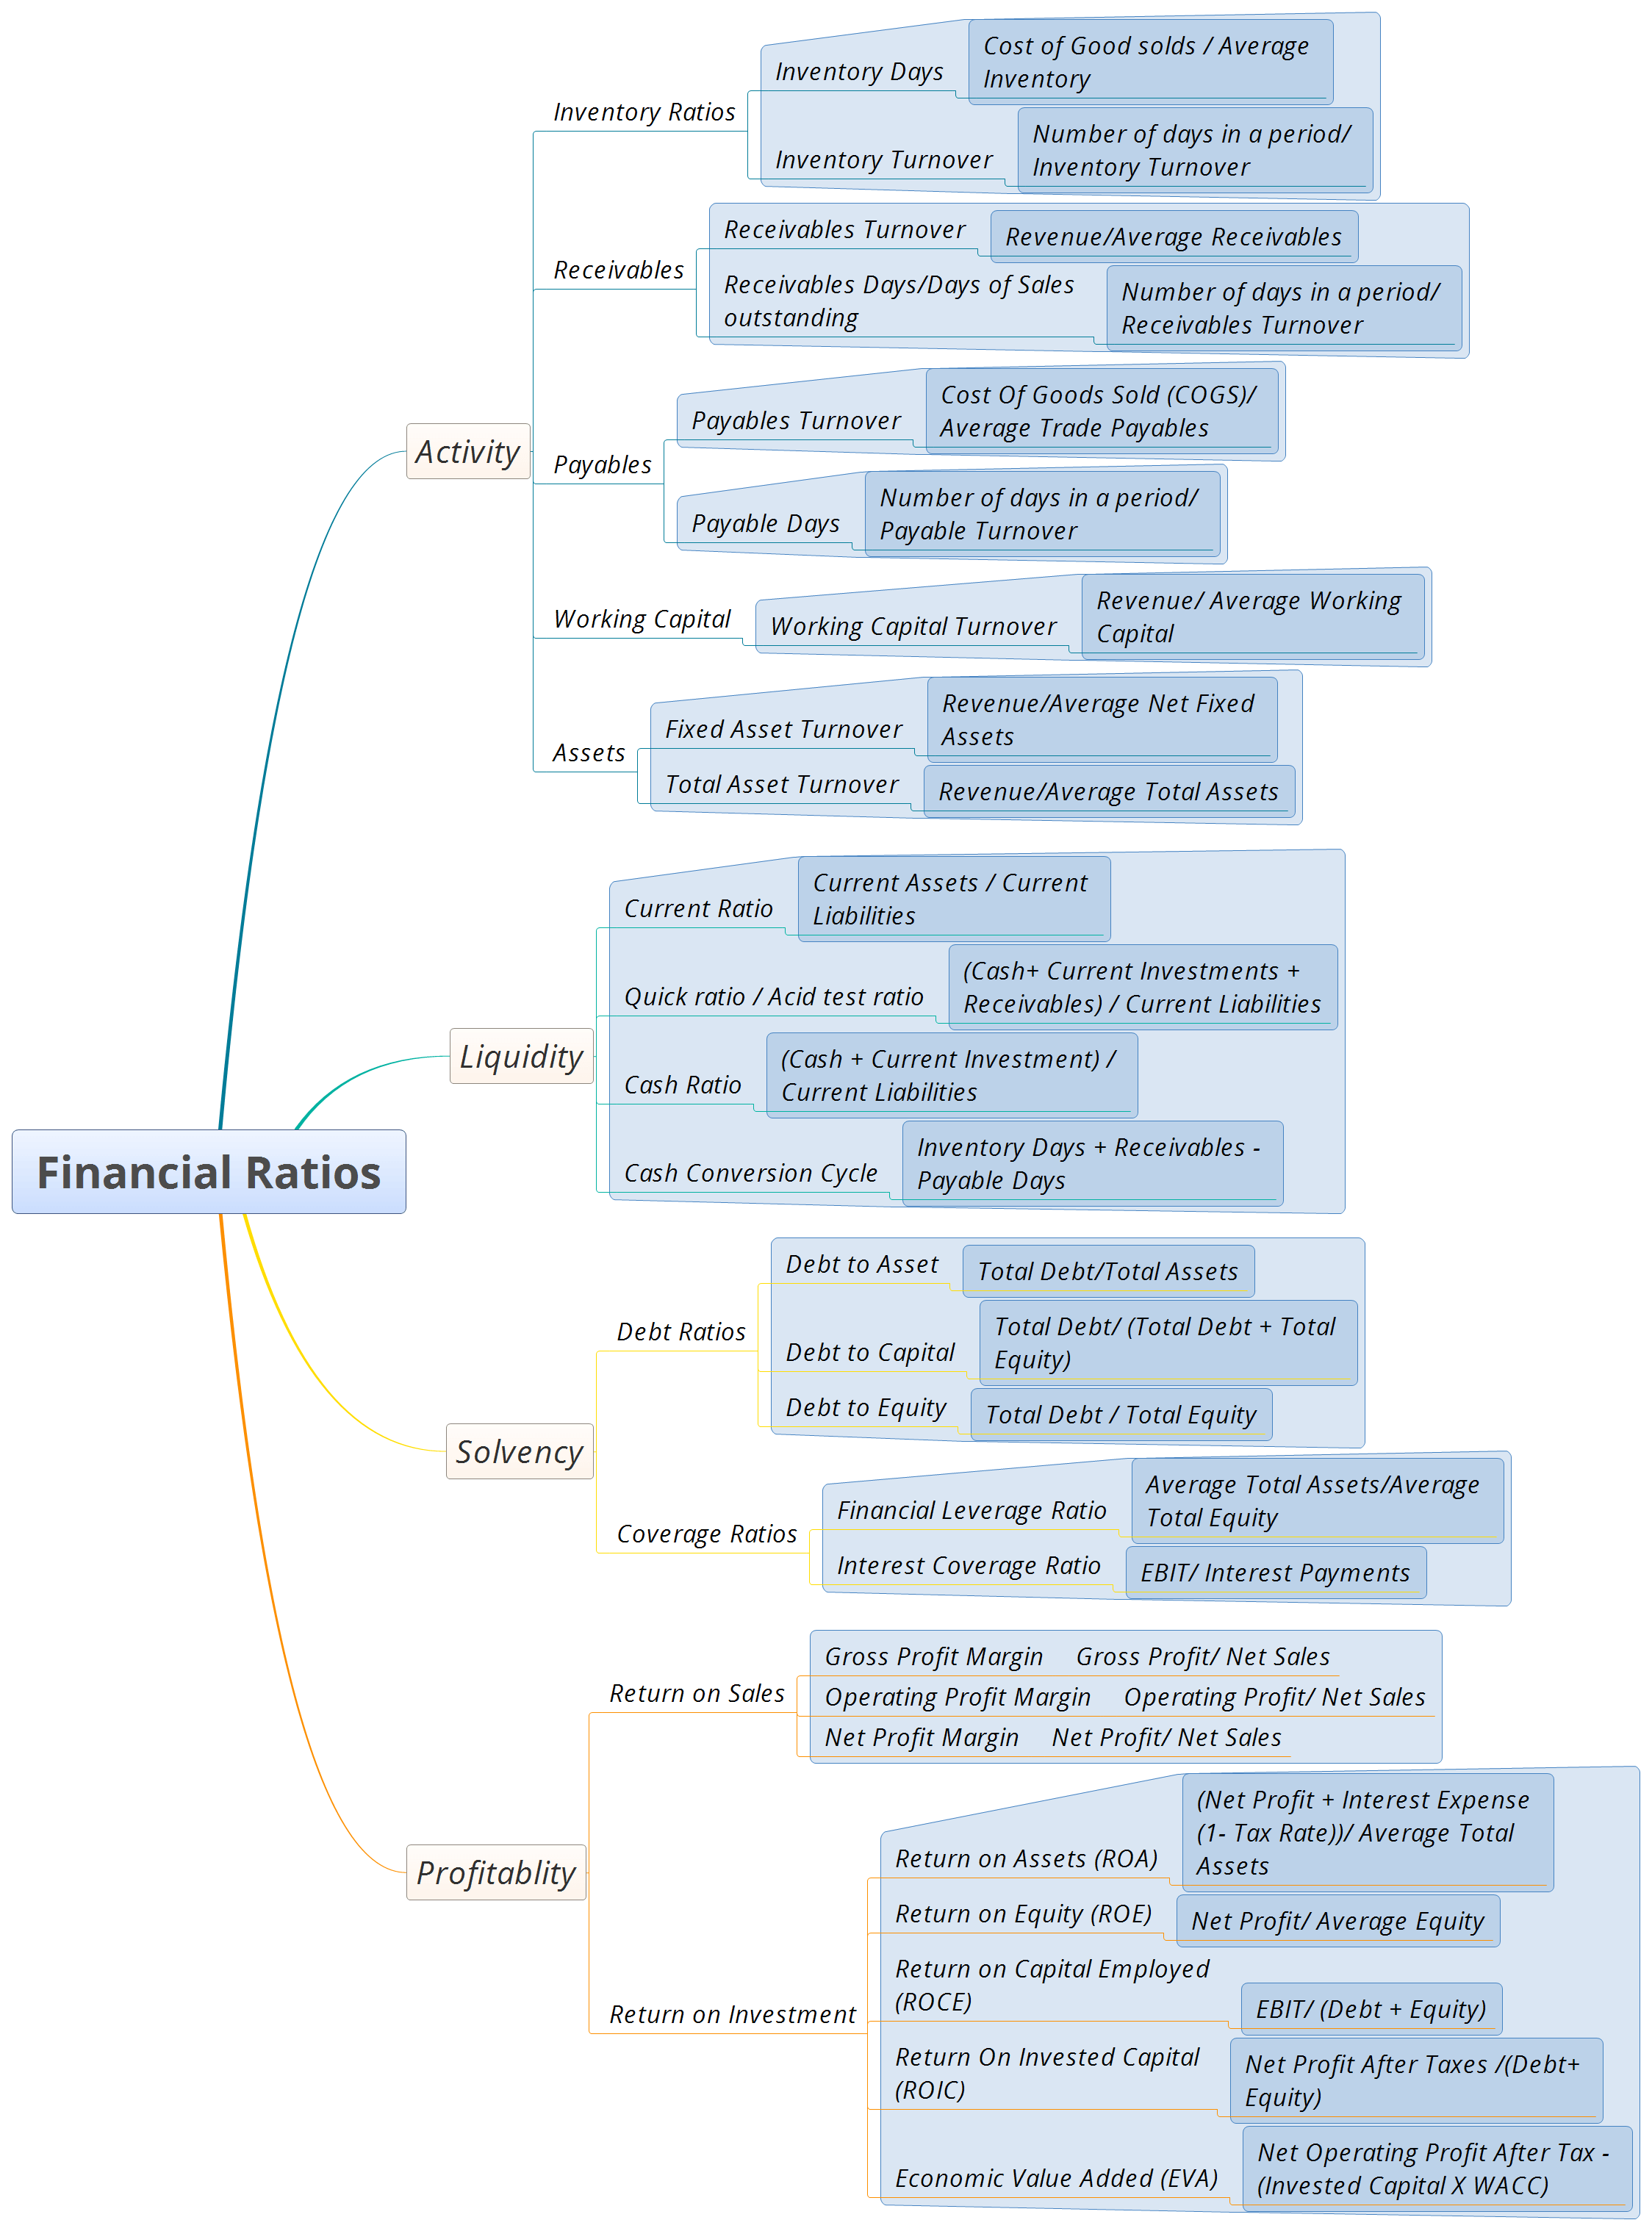 MindMap for Major Financial Ratios
Table of Content
- Ratio Categories
- General Points on Ratio Analysis
Ratio Categories
The number of different ratios that can be created is practically limitless. However,there are some widely accepted ratios that have been found to be useful. They can be categorized as follows:
| Ratios | Description |
|---|---|
| Activity | Activity ratios measure how efficiently a company performs day to day tasks, such as the collection of receivables and management of inventory |
| Liquidity | Liquidity ratios measure the company's ability to meet its short-term obligations. |
| Solvency | Solvency ratios measure a company's ability to meet long-term obligations. Subsets of these ratios are also known as "leverage" and "long-term debt" ratios. |
| Profitability | Profitability ratios measure the company's ability to generate profitable sales from its resources (assets) |
| Valuation | Valuation ratios measure the quantity of an asset of flow (e.g. earnings) associated with ownership of a specified claim (e.g. share or ownership of the enterprise) |
We should note that these categories are not mutually exclusive and we can use certain ratios to evaluate multiple aspects of the business.
Activity Ratios
Activity ratios are also known as asset utilization ratios or operating efficiency ratios. These are indicators of ongoing operational performance - how effectively assets are used by a company. These ratios reflect the efficient management of both working capital and longer-term assets.
Overview
The table is below :
| Activity Ratios | Numerator | Denominator |
|---|---|---|
| Inventory Turnover | Costs of good sold | Average inventory |
| Inventory Days | Number of days in period | Inventory turnover |
| Receivables Turnover | Revenue | Average receivables |
| Days of Sales outstanding | Number of days in period | Receivables turnover |
| Payables Turnover | Cost of goods sold | Average trade payables |
| Payables Days | Number of days in a period | Payables turnover |
| Working Capital Turnover | Revenue | Average working capital |
| Fixed Asset Turnover | Revenue | Average net fixed assets |
| Total Asset Turnover | Revenue | Average total assets |
Inventory Ratios:
1. Inventory Turnover
Inventory Turnover = cost of goods sold (COGS) /average inventory
- COGS can be calculated from the ‘Income statement’
- Average Inventory is the average of the inventory in the Company’s Balance Sheet’
Some key points related to Inventory Turnover:
- Higher the inventory turnover ratio, the shorter is the period that inventory is held.
- E.g. If the Inventory turnover ratio is 24 times/year, it means company theoretically turns over its inventory 2 times a month
- Company’s competitors inventory turnover should be compared to determine if the Inventory turnover ratio is good/bad. Its also prudent to take 5-10 year average as comparison.
2. Inventory Days
Inventory days measures how many days it takes a company to turn its inventory. Generally, the lesser the inventory days the better. It is important to note that inventory days varies from one industry to another
- Inventory Days= number of days in a period/ inventory turnover
Some key points:
- A low Inventory days (or High Inventory Turnover) relative to Industry norms might indicate highly effective inventory management.
- On the other hand, it could also indicate that company does not carry adequate inventory, so shortages can hurt revenue.
- To differentiate between the above two, We can compare the company’s revenue growth with that of industry.
- Slower growth along with higher inventory turnover indicates inadequate inventory levels
- Revenue growth at or above industry’s growth support the interpretation that high ‘Inventory Turnover’ reflects great inventory management efficiency.
Receivables :
Receivables turnover
Receivables turnover indicate the efficiency with which the company is collecting cash from its customers/debtors
- Receivables turnover = revenue / average receivables
Receivables days
This is also known as Days of sales outstanding
- Receivables days = number of days in a period / Receivable turnover
Some key points for receivables:
- A high receivables turnover (or low Receivables days) indicate high efficient credit and collection.
- A low receivables turnover (or high Receivables days) may indicate stringent credit and collection policies
- A comparison of company’s sales growth relative to the industry can help you assess whether sales are lost due to stringent credit policies.
Payables :
The payables turnover ratio measures how many times per year the company pays off all its creditors (like suppliers of raw materials)
- Payables turnover = costs of good sold / average trade payables
The payables days reflect the average number of days the company takes to pay its suppliers
- Payables days = number of days in a period /payable turnover
Some key points for payables:
-
A high payables turnover ratio (or low payables days) may indicate that company is not making full use of credit facilities; It could also result from company taking advantage of early payment discounts.
-
A very low payables turnover ratio (or high payables days) can indicate trouble making payments on time or maybe exploitation of lenient supplier terms.
-
If liquidity ratios (current ratio/cash conversion cycle) indicate that company has sufficient cash and other short term assets to pay obligations and still the payables days are high, it indicates lenient supplier credit and collection policies.
Working Capital :
Working capital is defined as (current assets - current liabilities). It can be calculated from the balance sheet.
Working capital turnover indicates how efficiently a company generates revenue with its working capital.
Working capital turnover= revenue / average working capital
Some key points
- A high working capital turnover ratio indicates great efficiency. E.g. A working capital turnover ratio of 30 indicates that company generates 34$ revenue for every 1 $ working capital.
- For some companies working capital can be zero or negative. We will need to look at “Asset” ratios in that case.
Asset :
Fixed Asset Turnover Ratio
Fixed Asset Turnover ratio measures how efficiently the company generates revenues from its investments in fixed assets.
Fixed Asset Turnover = Revenue / Average net fixed assets
- Average net fixed assets = tangible assets + intangible assets + capital work-in-progress
- tangible assets , intangible assets , capital work-in-progress can be known from ‘Balance Sheet’
Some key points:
- A high fixed asset turnover ratio indicates more efficient use of fixed assets in generating assets.
- We should again compare with competitors to know whether it is high or low.
- A low ratio can indicate inefficiency, a capital-intensive business. It can also indicate a new business not yet operating at full capacity.
- Asset turnover can also be affected by factors other than a company’s efficiency.
- The fixed assets would be lower for a company whose assets are newer (and therefore less depreciated ) and so reflected in the financial statements at high carrying value.
- Year to Year change may erratic as increase in fixed assets may not follow smooth pattern.
Total Asset Turnover
This ratio measures the company’s overall ability to generate revenues with a given level of assets.
- Total Asset Turnover = Revenue/ Average total assets
- A higher ratio indicates higher efficiency.
- Ratio includes both fixed and current assets. Inefficient working capital management can distort overall interpretations.
- It is always better to analyze working capital ratios and fixed turnover ratios separately
Liquidity Ratios
An analysis of a company’s liquidity focuses on its cash flow, and measure its ability to meet short-term obligations. Liquidity measures how quickly assets are converted into cash. They also measure a company’s ability to pay off its short-term obligations.
| Liquidity Ratios | Numerator | Denominator |
|---|---|---|
| Current Ratio | Current assets | Current Liabilities |
| Quick Ratio/ Acid Test Ratio | Cash + Current Investments + Receivables | Current Liabilities |
| Cash Ratio | Cash + Current Investments | Current Liabilities |
| Cash Conversion Cycle | Inventory Days + Receivables days - Payable Days |
- Liquidity measures how quickly assets are converted into cash
- They also measure a company’s ability to pay off its short-term obligations
Current ratio
The most immediate danger faced by a lender is the risk that the borrower will suffer illiquidity - an inability to raise cash to pay its obligations. Illiquidity measures itself as an excess of current cash payments due, over cash currently available.
The current ratio gauges the risk of this occurring.
current ratio= current assets/ Current liabilities
- A higher ratio indicates a higher level of liquidity (i.e, a greater ability to meet short term obligations).
- A lower ratio indicates less liquidity , implying a greater reliance on operating cash flow and outside financing to meet short-term obligations.
Quick ratio/ Acid test ratio
In Quick Ratio, Only cash and current assets that can be most quickly converted to cash (marketable securities and receivables)
Quick Ratio = (Cash+ Current investments + Receivables ) /Current liabilities
- Quick Ratio reflects the fact that current assets like inventory might not be easily and quickly converted into cash. In situations when inventories are illiquid (can be indicated by low inventory ratios), the quick ratio may be better indicator of liquidity than the current ratio.
Cash ratio
The cash ratio is an indicator of a company’s liquidity that further refines both the current ratio and the quick ratio by measuring the amount of cash, cash equivalents or invested funds there are in current assets to cover current liabilities.
- (cash + current investments) / current liabilities
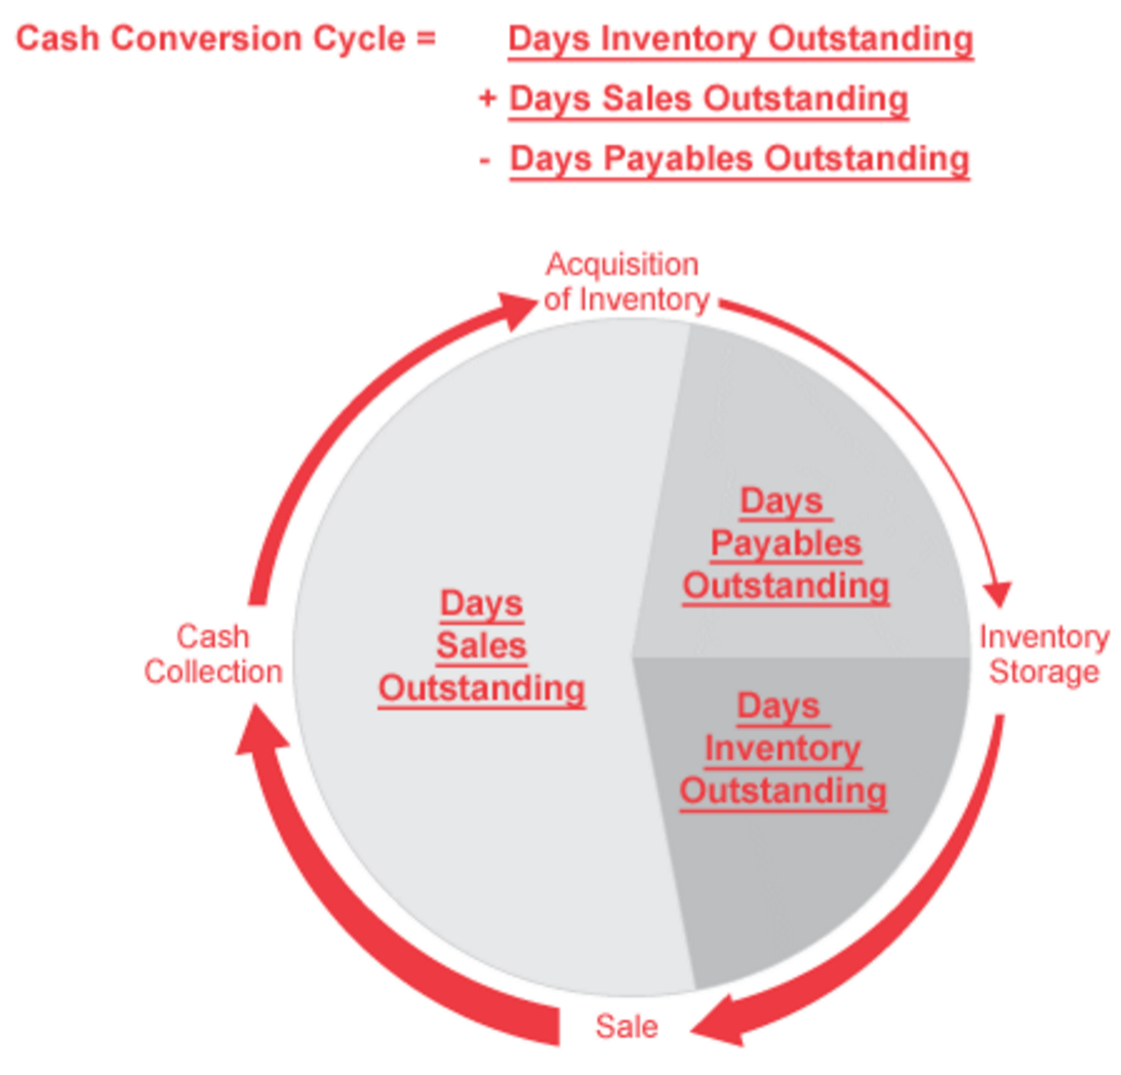
Cash conversion cycle
Cash Conversion Cycle indicates the amount of time that elapses from the point when a company invests in working capital until the point at which the company collects cash.
Cash Conversion Cycle= Inventory days + receivables days - payable days
- Some companies have a negative cash conversion cycle which means that its cash collection (from its customers) happens faster than its cash payments (to suppliers of raw materials etc. )
- A short cash conversion cycle indicates great liquidity. A short cycle also implies that the company needs to finance its inventory and trade receivables for only a short period of time.
- A long cash conversion cycle indicates lower liquidity. It can also imply that the company must finance its inventory and trade receivables for a longer period of time.
The below image shows the cash conversion cycle :
Solvency Ratios
Solvency Ratios help assess a company’s ability to fulfill its long-term debt obligations. Solvency ratios provide information regarding the relative amount of debt in the company’s capital structure and the adequacy of earnings and cash flow to cover interest expenses and other fixed charges (e.g. lease or rental payments) as they come due.
Understanding a company’s use of debt is important. One of the reasons is that amount of debt in a company’s capital structure is important for assessing the company’s risk and return characteristics, specifically its financial leverage.
| Solvency Ratios | Numerator | Denominator |
|---|---|---|
| Debt-to-Assets Ratio | Total Debt | Total Assets |
| Debt-to-Capital Ratio | Total Debt | Total Debt + Total Equity |
| Debt-to-Equity Ratio | Total Debt | Total Equity |
| Financial Leverage Ratio | Average Total Assets | Average Total Equity |
| Interest Coverage Ratio | EBIT | Interest Payments |
Debt Ratios
Debt Ratios focus on the balance sheet and measure the amount of debt capital relative to capital.
Debt to Asset
Debt-to-Asset = Total Debt / Total Assets
- This ratio measures the % of total assets financed with debt.
- High Debt means higher financial risk and weaker solvency.
- E.g A D/A ratio of .70 or 70% indicate that 70% of the company’s assets are financed with debt.
Debt to Capital
Debt-to-Capital = Total Debt/ (Total Debt + Total Equity)
- This ratio measures % of company’s capital financed with debt.
- Higher Ratio means financial risk and thus weaker solvency.
Debt to Equity
Debt-to-Equity (D/E) = Total Debt/ Total Equity
- This popular ratio measures amount of debt relative to equity capital.
Coverage Ratios
Coverage Ratio - Interest Coverage focus on the income statement and measure the ability of a company to cover its debt payments.
Financial Leverage (Leverage Ratio)
Financial Leverage = Average Total Assets/Average Total Equity
- This ratio measures the amount of total assets supported for each one money unit of equity.
- E.g. A value of 4 would mean that each 1$ of equity supports 3$ of total assets.
- Everything else being equal, A company with higher financial leverage is riskier than a company with lower financial leverage.
Interest Coverage
Interest Coverage Ratio =EBIT/Interest Payments
- This ratio measures a number of times a company’s EBIT (Earnings before Interest and Tax) could cover its interest payments.
- A higher interest coverage ratio indicates stronger solvency, offering more assurance that the company can service its debt from operating earnings.
Profitability Ratios
Profitability is a key determinant of a company’s overall value and the value of the securities it issues. A company’s profitability reflects its competitive position in the market and by extension, the quality of its management.
Below is the table representing most Profitability Ratios:
| Profitability Ratios | Numerator | Denominator |
|---|---|---|
| Return on Sales | ||
| Gross Profit Margin | Gross Profit | Revenue |
| Operating Profit Margin | Operating Profit | Revenue |
| Net Profit Margin | Net Profit | Revenue |
| Return on Investment | ||
| Return on Assets | Net Profit + Post-Tax Interest | Average Total Assets |
| Return on Capital Employed | Profit before Interest and Tax (PBIT) | Debt + Equity |
| Return on Equity | Net Profit | Average Equity |
Return on Sales
These ratios express various profits on the Income Statement (like gross profit, operating profit, and net profit) as a percentage of revenue or sales.
Gross Profit Margin
Gross Profit Margin = Gross Profit/ Net Sales
-
Here, Gross Profit= Net Sales - Cost of Good Solds (COGS)
-
Higher Gross Profit Margin indicates combination of higher product pricing and lower product costs relative to competition.
Operating Profit Margin (EBIDTA Margin)
Operating Profit or EBIDTA Margin = Operating Profit/Net Sales
- Here , Operating Profit or EBIDTA = Gross Profit - Operating Costs
Some key pointers for Operating Profit Margin:
- It is a good measure of management’s efficiency. It compares the quality of company’s activity to its competitors . A company that has a higher operating margin than its peers in the industry is generally doing better.
- We should check if reason for higher operating profit margin is not by taking on higher debt or taking risky measures.
- Low operating cost model could be one of the reasons of higher operating profit margin.
- A rising operating profit margin could lead to higher earnings growth.
Net Profit Margin
Net Profit Margin (NPM) = Net Profit/ Net Sales
- Here, Net Profit = (Revenue - All Expenses ) (from the Income Statement)
Some key pointers for NPM :
- NPM tells you how much after-tax profit the business makes for every 1$ it generates in revenue or sales.
- A high NPM can indicate few things:
- Company has a brand or a moat and able to carry a price premium.
- Company is in a business where it has a monopoly or is part of an oligopoly over a particular type of good or service.
- NPM varies by industry.
Return on Investment
These ratios measure a company’s various profits relative to its assets, equity, or total capital employed. These ratios are very useful to have a quick view of the company’s health.
Return on Assets
Return on Assets (ROA) measures the return earned by a company on its assets. The higher the ratio, more income is generated by a given level of assets. This ratio helps both management and investors see how well the company can convert its investments in assets into profits.
ROA = (Net Profit + Interest Expense (1- Tax Rate)) / Average Total Assets
- We add back interest because ROA measures return on all assets invested in the company, whether finances with liabilities, debt, or equity
Return on Equity (ROE)
Return on Equity measures the return earned by a company on its equity capital. Return on equity is an important measure of the profitability of a company. Higher values are generally favorable and indicate that the company is efficient in generating income on new investment. Investors should compare the ROE of different companies in the same sector and also check the trend in ROE over time. ROE serves as a good gauge of management’s capabilities.
ROE = Net Profit / Average Equity
The Du Pont Analysis of ROE gives a lot of insight regarding how different aspects of performance affects the company’s profitability. We will look at Du Pont Model and make connections of ROE with other ratios.
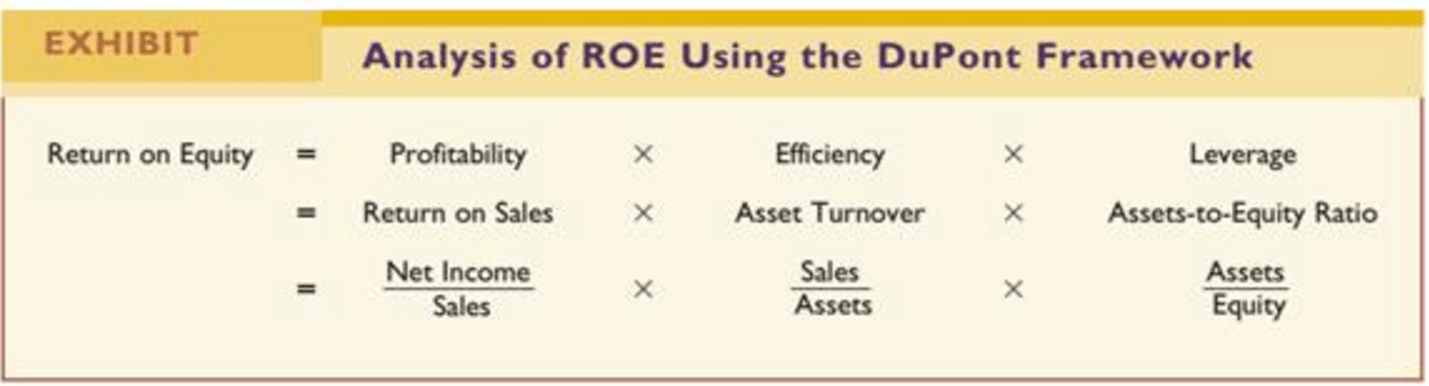
Decomposing ROE Using DU Pont Analysis
To understand what drives a company’s ROE , a useful technique is to decompose ROE into its component parts, using the DuPont Model. The Decomposition allows us to evaluate how different aspects of performance affected the company’s profitability as measured by ROE.
The three-step Du Pont model is calculated as follows:
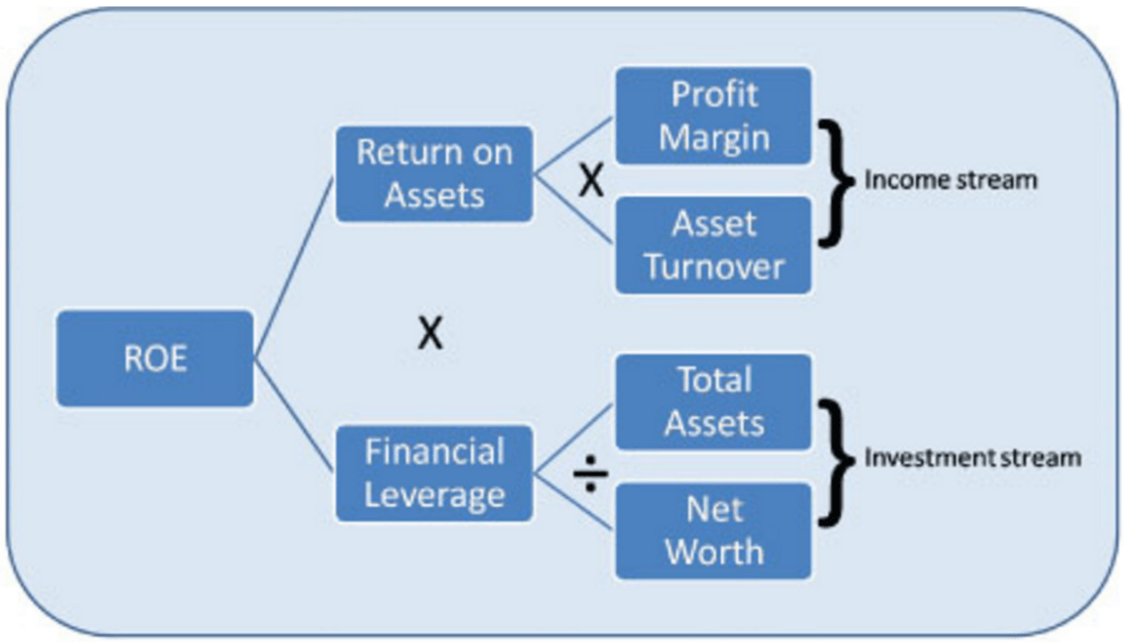
ROE = Net Profit Margin X Asset Turn Over X Financial Leverage
ROE and ROA are related to each other :
ROE = ROA X Financial Leverage
Return on Capital Employed (ROCE)
- Return on Capital Employed measures the profits a company earns on all of the capital that it employs (short-term debt, long-term debt, and equity).
- ROCE is a useful metric for comparing profitability across companies based on the amount of capital they use.
- ROCE is a long-term profitability ratio because it shows how effectively assets are performing while taking into consideration long-term financing.
ROCE = EBIT / (Debt + Equity)
- Here, EBIT= Earnings before Interest and Tax
Return on Invested Capital (ROIC)
ROIC tells how efficient the firm was in investing capital in profitable investments.
ROIC is calculated as :
- ROIC = Net Operating Profits After Taxes (NOPAT) / (Debt+ Equity)
- Invested Capital = Debt + Equity
- NOPAT = (Operating Income) X (1- Tax Rate)
Some pointers for ROIC:
- A firm’s ROIC can be an excellent indicator of the size and strength of its moat.
- ROIC is especially useful for companies that invest a large amount of capital, like oil and gas firms, computer hardware companies
- The one major downside to this ratio is that it doesn’t specify if the return is more from continuing operations or a single event.
- The upside to this ratio is that it can be used to compare firms with different capital structures
Comparing ROIC with Weighted Average Cost of Capital (WACC)
WACC is the minimum rate of return that a firm needs to earn for its stakeholders. Cost of capital refers to the opportunity cost of making a specific investment. It is the rate of return that could have been earned by putting the same money into a different investment with equal risk.
- When ROIC is greater than WACC, value is being created for the stakeholders. When this ratio is less than WACC, value is being destroyed.
- Investors should look at the spread between ROIC and WACC for a firm. On very broad terms, a firm with a higher spread between ROIC and WACC tends to be more valuable than a firm with a lower spread.
Economic Value Added (EVA)
- EVA is the value generated from funds invested in a business. It serves as a reflection of management performance.
- If the EVA turns out to be negative, this means a business is destroying value on the funds invested in it.
EVA = Net Operating Profit After Tax - (Invested Capital x WACC)
- Here, Net Operating Profit After Tax (NOPAT) = (Operating Income) X (1- Tax Rate)
- Invested Capital = Debt + Equity
- WACC = Weighted Average Cost of Capital
General Points on Ratio Analysis
There are several aspects of ratio analysis are important to understand.
- The computed ratio is not an answer. The ratio is just an indicator of some aspect of a company’s performance telling what happened but not why it happened.
- The differences in accounting policies (across companies and across time) can distort ratios.
- All ratios are not necessarily relevant to a particular analysis.
- Ratio analysis does not stop with computation; interpretation of the result is essential.
Leave a Comment