
How to Lie with Statistics
Table of Content
- Introduction
- Biased Samples - The samples with the built in bias
- The Well Chosen Average
- Discarded Data, The data which is absent.
- Graph Manipulation
- Correlation vs Causation
- Semi Attached Figure
- How to Statisticulate/Manipulate
- How to talk back to Statistics
- References
Introduction
Semantics basically means “Study of meaning”. Semantically correct means that you’re calling something what it actually is.
“Without Writers who use the words with honesty and understanding and readers who know what they mean, the result can only be semantic nonsense”
“A well-wrapped statistic is better than Hitler’s big lie; it misleads yet it cannot be pinned down” The crooks already know these tricks; honest men must learn them in self defense.
Sneaky use of statistics is quite common in news, media and even medical research. Once we know this statistical tricks it is difficult to unsee them.
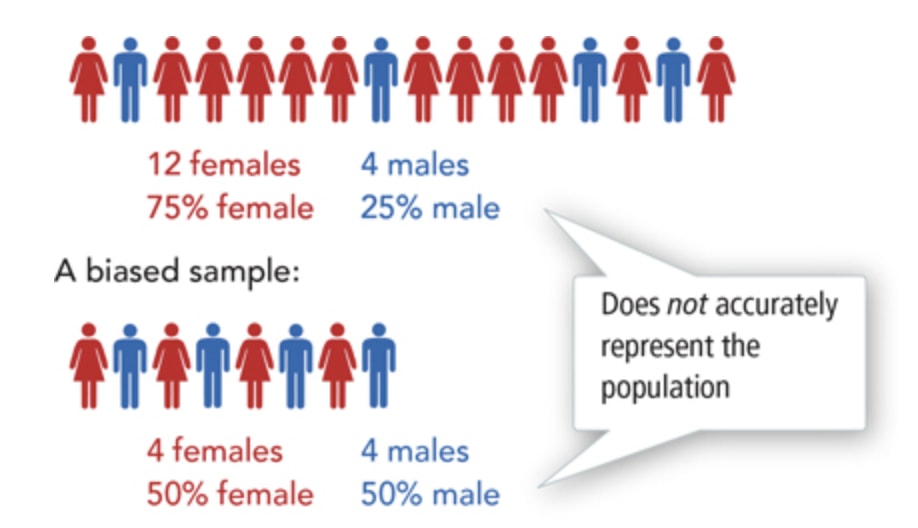
Biased Samples - The samples with the built in bias
“Average Americans brushes their teeth 1.02 times a day.” When we hear these statistic, We can ask many questions. :
- How could they have figured out
- Does it make sense that it could have been researched properly. In case if it had been researched, don’t we think that people could have lied ?
Many conclusions we see come from samples that are too small , biased or both. If our sample is large enough and selected properly , it will represent the whole well enough for most purposes. If it is not, it may be far less accurate than an intelligent guess.
A result of a sampling study is no better than the sample it is based on . By the time data have been filtered through layers of statistical manipulations and reduced to a decimal pointed average, the result would look very convincing. A close look at the sample will dent the confidence.
A pure random sample is the only kind that can be examined with complete confidence by statistical theories. There is one big thing wrong there. It is so difficult and expensive to obtain for many uses that the sheer cost eliminates it. A more economical substitute which is almost universally used in such fields as opinion polling and market research, is called stratified random sampling.
To get stratified random sampling, we divided the population into several groups in proportion to their known prevalence. There are few big issues there :
- The information about the proportions may not be correct.
- On top of that, how do you get a random sample within the stratification?
The obvious thing is to start with a name of everyone and go after names choses from it randomly. but this is too expensive.
So we go into the streets, bias your sample against stay at home people. We go from door to door by day and miss out on employed people . We switch to evening interviews and neglect the movie-goers and night-clubbers.
To summarize it is very important to choose the right sample selection process and to do it correctly so that exact findings may be attained. For Clients it is important to inquire about the sample selection process to understand the possible biases in the Results.
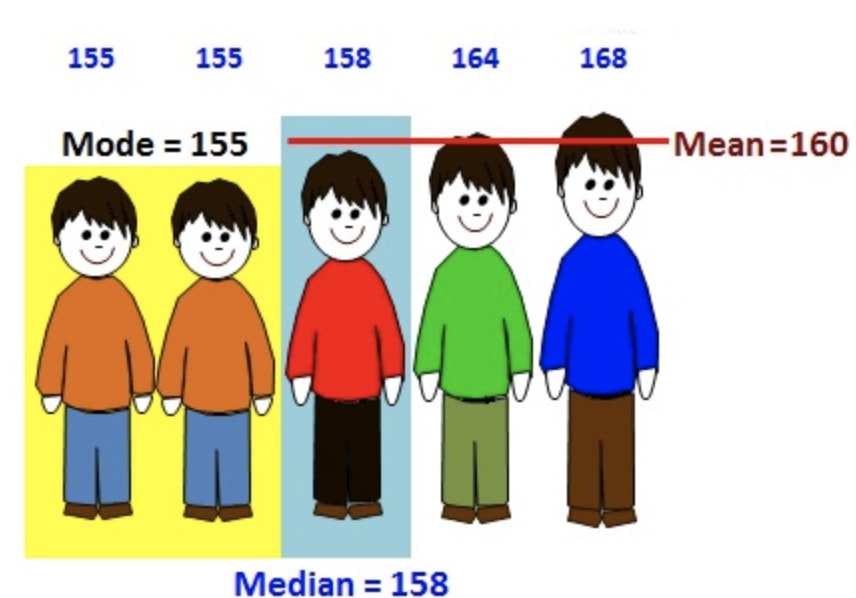
The Well Chosen Average
There are tricks that can be manipulated by the user/researcher while using average in describing any fact. The main idea is that there are three types of averages rather than one which is commonly assumed. The same data can give three different types of values when all three types of averages are calculated.
The 3 type of averages are :
- Mean : The mean is the usual average
- Median : The median is the median value, after sorting the data in order.
- Mode : The mode is the number repeated more often than any other number .
We assume that these are same but in reality different kind of scenario requires different kinds of average to describe the situation precisely. The reporters and others many times choose the one that supports their argument.
In normal distributions (Bell curve) , the three will be near to each other but in irregular distributions (e.g annual household income), these numbers will be vastly different.
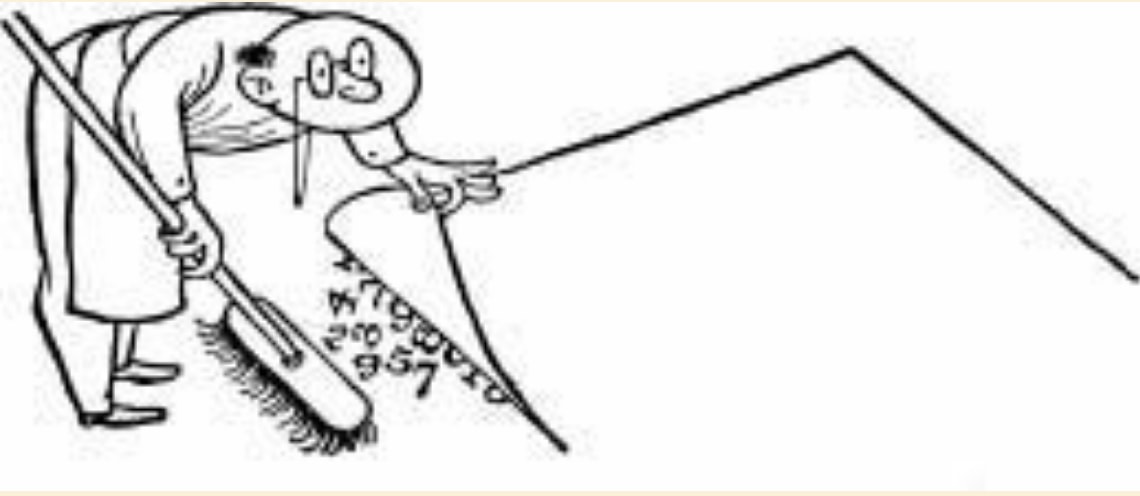
Discarded Data, The data which is absent.
The statistics that are used by the marketing of advertising world of consumer products can be tricky. Obviously the statistics are highly going to be in favor of the product. However there are many underlying tricks.
First the sample size can be very small. With smaller sample sizes, the variance is large. With 10 coin flips you can get 8 heads, but you’re not much likely to get 80 heads in 100 coin flips.
By hiding the prevailing situation or pros and cons of an environment, any result of any study can be diverted according the desire of the researcher.
Companies can keep running experiments until they get the results they want, discarding the experiments that failed to produce “significant findings.”
In summary , statistics is often used to prove some irrational proposition where there is no actual scope or reason. In doing so , they amplify a very small difference between two phenomena and try to prove one’s superiority over other but which difference is basically very normal.
Graph Manipulation
Numbers are not always good enough or adequate to make any report worthy or comprehensible. There is no doubt that pictures are easy to understand and there is no better way to way to make numbers comprehensible to mass people.
Lets look at some graph examples
Non Zero Baseline
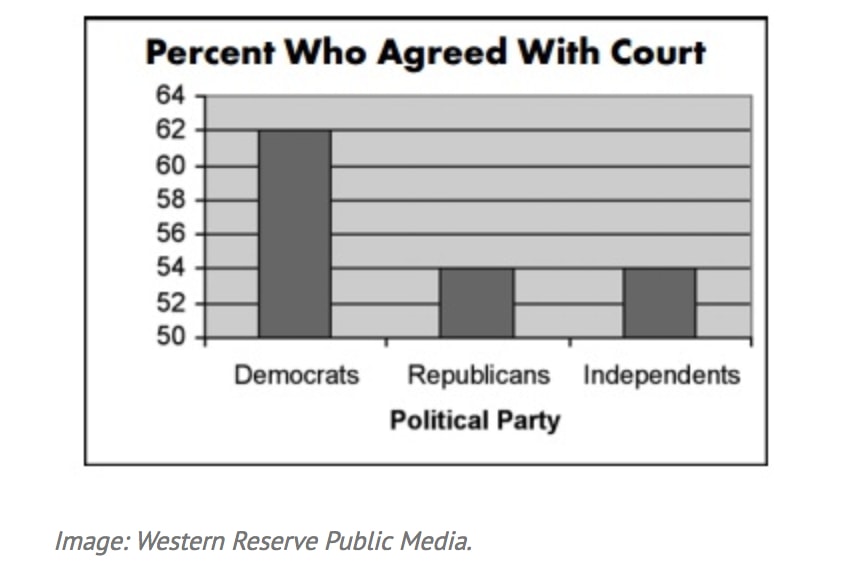
A first look at this graph makes it look like three times as many democrats supported the decision. But on closer inspection, note the scale on the vertical axis. Only slightly more democrats supported than republicans (62% vs. 54%).
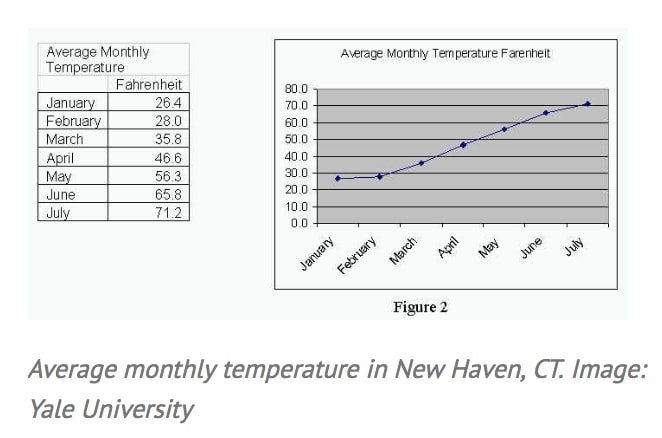
Incomplete Data
If you really want to make a shocking statement, make sure you only include part of the data. Take this first example of a misleading graph that proves global warming is real. In the graph and data below only Jan-July month data is included!
Correlation vs Causation
Smoking can take the grades of a student downward; It was a finding that made a good number of people happy. The study was conducted meeting all the standards of statistics but it was based on the ancient fallacy that tells that “if B follows A, then A has cause B” . Correlations are part of our everyday life, and it is so easy to be misleading and assume it as a cause of some event.
It can very well be other way round that low grades may lead to smoking. Another fact is that both smoking and low grades can be result of third factor of not taking books seriously.
The trick used very commonly in media is relating an issue with another non-relevant issue very smartly just to serve the purpose of the presenter. In some cases there might be a positive correlation but this correlation too works up to a mark to grow the effect positively but after that it may hinder.
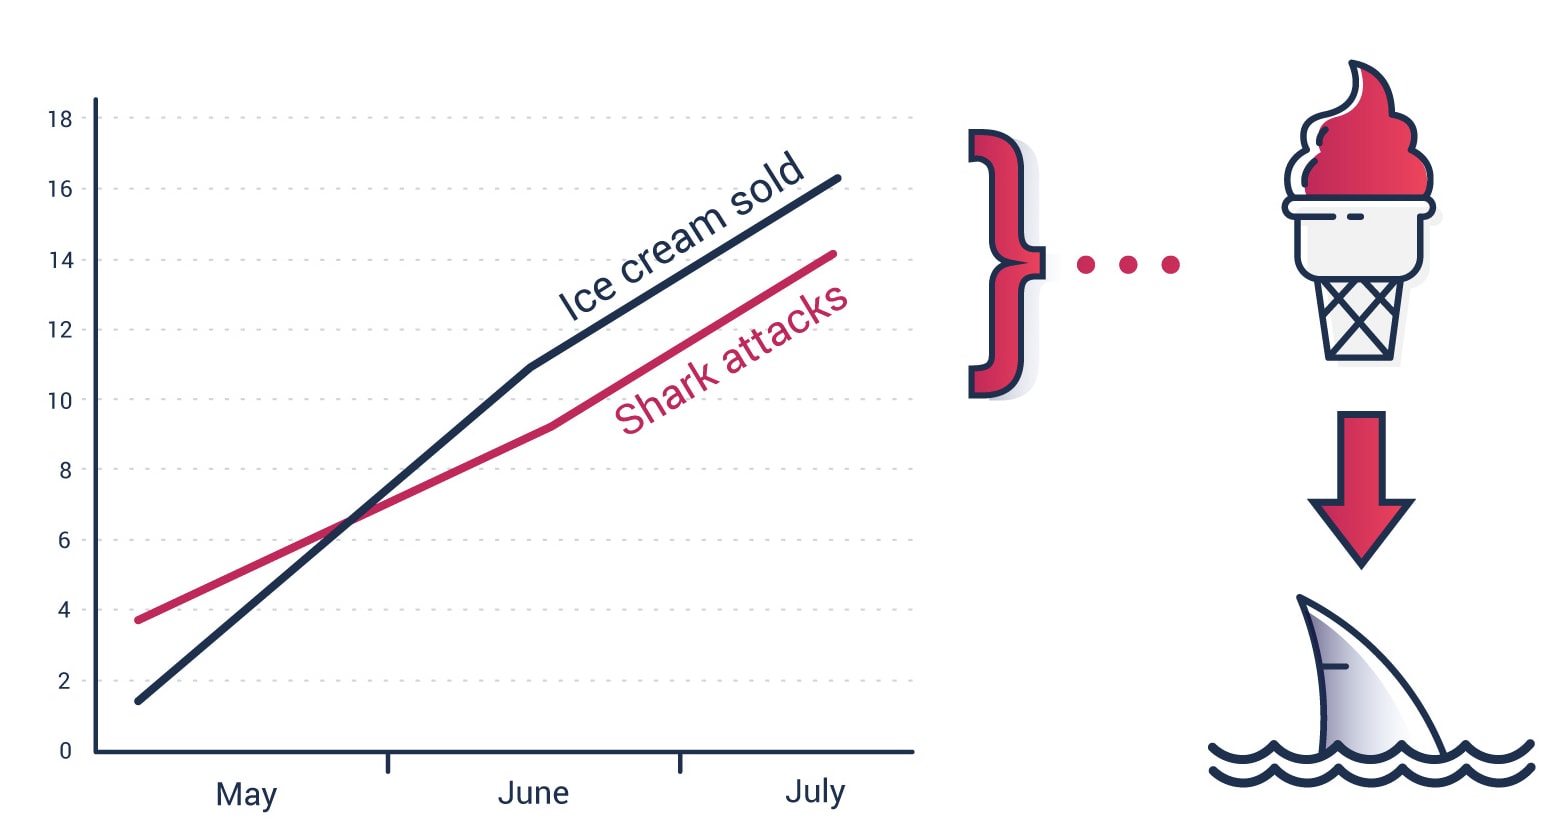
Have a look at the image above. At first glance , it may appear as if ice cream sales and shark attacks are correlated. Should we believe that sharks are attracted to ice creams and hence shark attack happens? The answer, of course, is No! Shark attacks are likelier to happen in summer, which is also the season when ice cream consumption goes up.
The main idea here is that there might be correlation between two events but there are other factors influencing and bringing changes. The kind of manipulation done here is to relate on one of the hundred possible effects which is not exclusive at all with the concerned issue and to claim that this input has bought the result.
Semi Attached Figure
“If you can’t prove what you want to prove, demonstrate something else and pretend that they are the same thing.”
The semi attached figure is a tool that can be used to cope with any situation that is not much in favor of presenter.
Consider some examples :
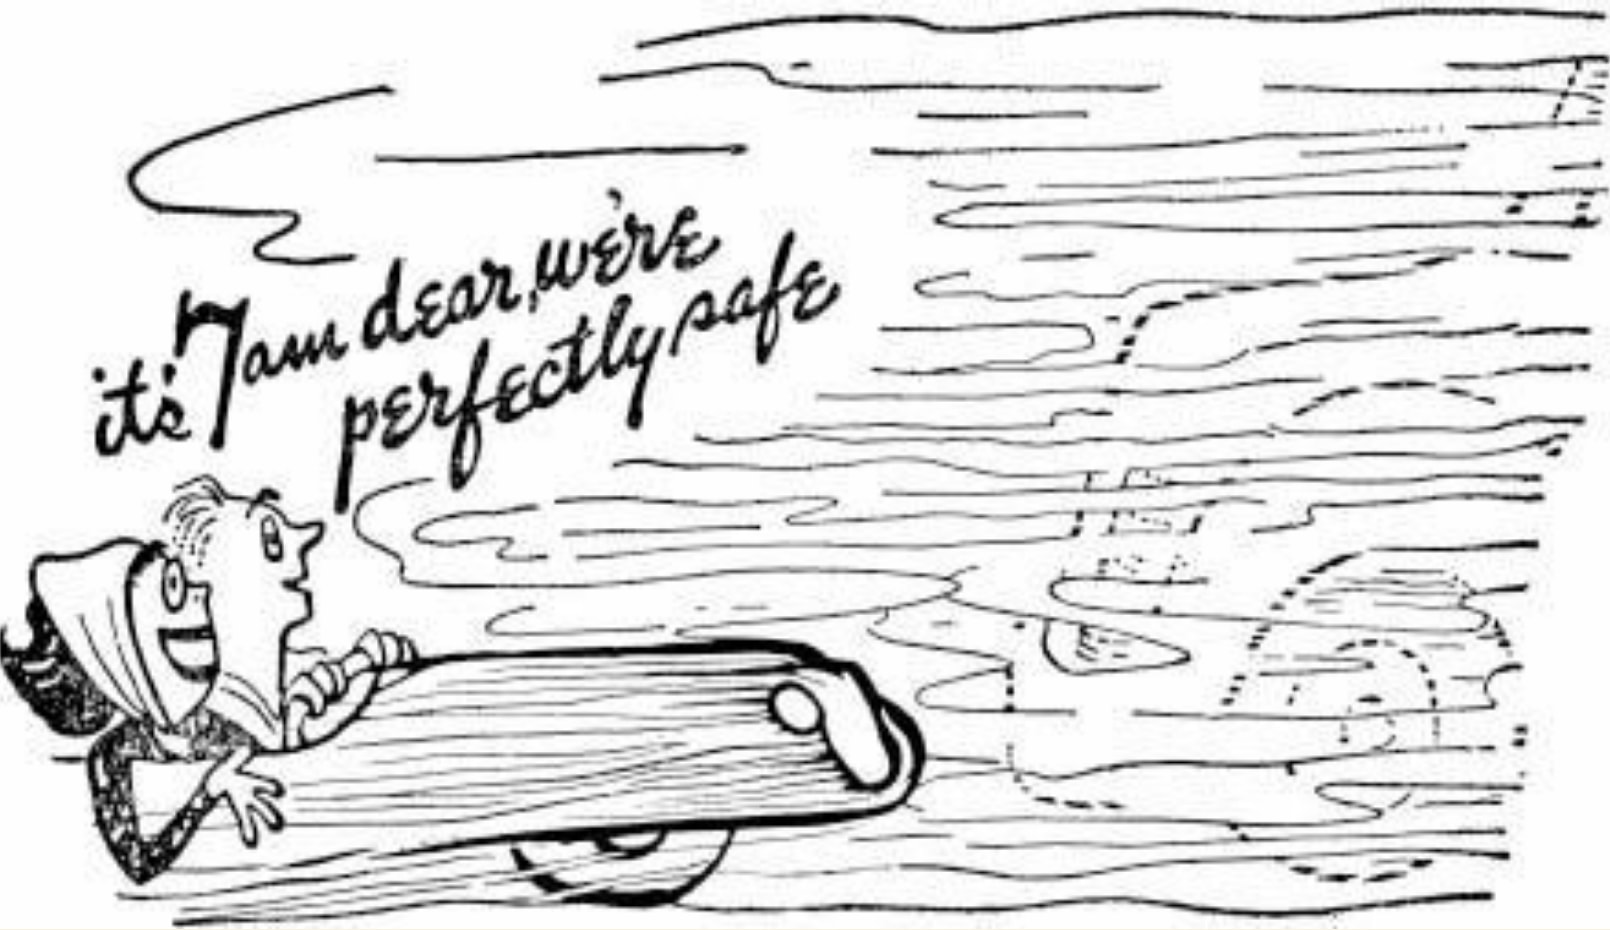
- Clear weather is more dangerous than foggy weather as more accidents occur in clear weather. More accidents happen in clear weather because there is more clear weather than foggy weather.
- The remedy of cold that kills germs not only kills that specific germ but also all the different types of germs in the test tube. The smartness here is not to tell about the other germs but only about the specific germ.
Another trick is based on the fact that same data can be expressed in different ways. For e.g. same fact about a company can be
- 1% return on sales
- 15% return on investment
- a 10 million $ profit
- an increase in profits of 40% compared with some old average
- a decrease of 60% from last year
All these stories are told partially which is partially true but the whole story brings a different meaning.
How to Statisticulate/Manipulate
It is not always the statisticians who are busy to produce manipulated statistics. Rather a good or pure set of findings may be found distorted in the market by sales man. Sometimes the policy designers or statisticians are not that much skilled to find or interpret the exact relationship between two events/phenomena and that leads to a poor policy
Percentages and Percentage offer a fertile field for confusion. And like the ever-impressive decimal they can lend an aura of precision to the inexact.
Example : There is a tale of a roadside merchant selling rabbit sandwich .
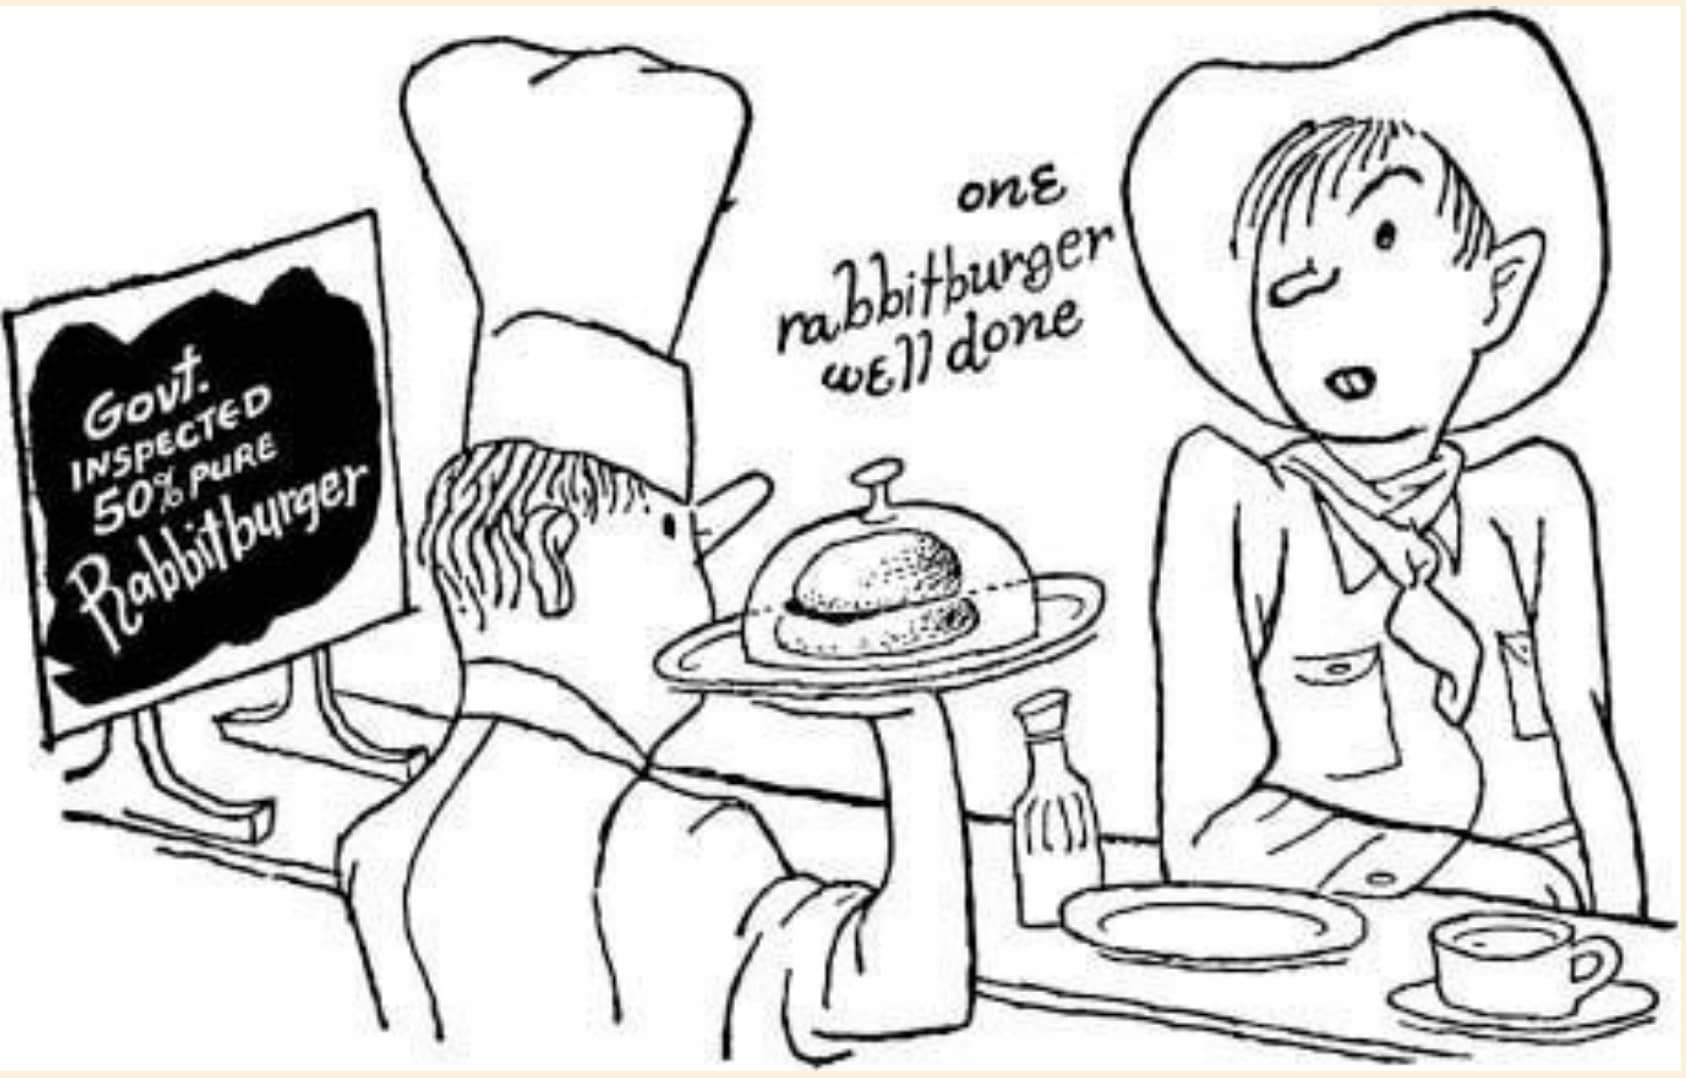
He was asked to explain how he was able to sell rabbit sandwich so cheap. “Well,” he said, “I have to put in some horse meat too. But i mix’em 50:50, one horse, one rabbit !!”
How to talk back to Statistics
5 simple questions :
Who says so ?
The “Who” question affects the reliability of the information.
First thing to look for is bias - the laboratory with something to prove for the sake of a theory, a reputation, or a fee.
Look for a conscious bias. The method may be direct misstatement or it may be ambiguous statement that cannot be convicted. It may be selection of favorable data and suppression of unfavorable data. Units of measurement may be shifted . A different average like median , mode may be used covered under the unqualified word “average”
Look carefully for unconscious bias. It is often lot more dangerous
How does he know?
In what way the information for the study was known? Was it reliable? Did people respond honestly?
What’s missing?
It is noticed that the most used technique to present distorted information is to hide information. So seeking hidden or missing information can reveal lot more truth than the author says.
Did someone change the subject?
It is like changing the direction of the study and present a different kind of result.
Does it make sense
Any statistical calculation will lead us to infer decision from it. As it is obvious, we will be lured to infer on the basis of that calculation. It is not necessary that every inference is meaningful .
So as a common man, and not being an expert the last question to ask is that does it make sense or just irrational and out of context.
References
- Book - How to lie with Statistics - Darrell Huff
- Internet for pictures
Leave a Comment